Digital Signage - PLN UPDL Palembang
A serverless digital signage system powered by Next.js and Google Workspace. It transforms Google Sheets data into a real-time, premium glassmorphism TV display for classroom schedules with zero learning curve for admins.
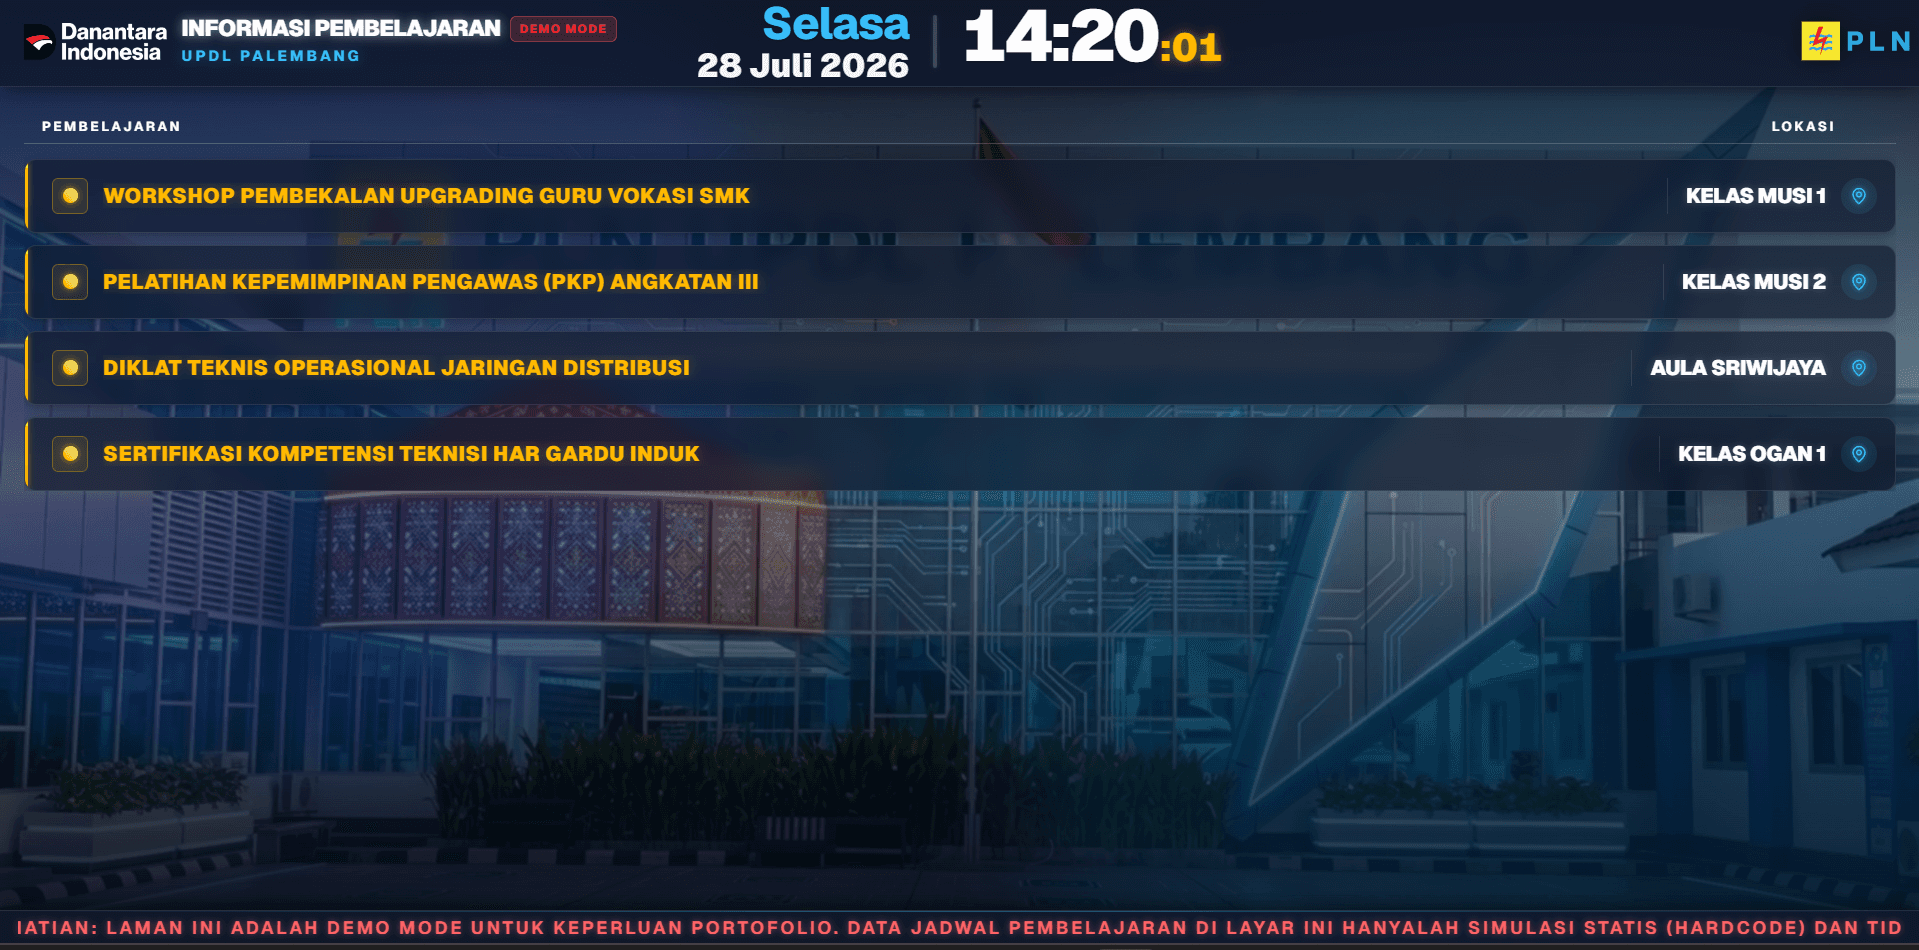
Why This Matters
UPDL Palembang holds multiple training classes in different rooms every day. New participants often don't immediately know which room to go to. The front office also potentially receives the same questions repeatedly regarding classroom locations. Information that is easily accessible as soon as participants enter the building will improve the participant experience while reducing manual communication load.
The Problem
The schedule data is actually available, but it was only used for internal operational needs. TVs in public areas were not utilized as real-time information media, so participants still had to ask the staff. As a result, information was not disseminated proactively.
Existing Workflow
Constraints
- Zero budget for commercial Digital Signage CMS.
- Schedules are already managed via Google Spreadsheet, so we cannot change the admin's workflow.
- Multiple TVs will display the same information.
- TVs run continuously all day, so the page must be stable for long-term use.
- The display must be easily readable from a distance.
Stakeholders
- Trainees (Peserta Diklat)
- Front Office
- Learning Admins (Admin Pembelajaran)
- UPDL Management
Success Criteria
- Admins continue working using the exact same spreadsheet.
- The TV always displays today's learning schedule.
- No manual browser refreshing is required.
- All TVs always display the latest synced data.
- The interface is highly legible from a distance.
Goals
- Transform a spreadsheet into a real-time data source.
- Eliminate the need for manual TV updates.
- Display information that participants actually need.
- Ensure all TVs are always synchronized.
Before vs After
| Before | After |
|---|---|
| Spreadsheet was only used by admins. | Spreadsheet becomes the single source of truth. |
| TVs provided no contextual information. | TVs automatically update when the spreadsheet changes. |
| Participants had to ask staff. | Participants instantly know their room locations. |
| Manual or non-existent TV updates. | Zero manual refresh required. |
Spreadsheet was only used by admins.
Spreadsheet becomes the single source of truth.
TVs provided no contextual information.
TVs automatically update when the spreadsheet changes.
Participants had to ask staff.
Participants instantly know their room locations.
Manual or non-existent TV updates.
Zero manual refresh required.
Architecture
Google Sheets
Admin updates schedule
Apps Script
Acts as a REST API
Next.js
Fetches & renders UI
Auto Polling
Background sync
Engineering Decisions
| Decision | Alternatives | Why This Choice |
|---|---|---|
| Google Spreadsheet as Source of Truth | Custom Database (PostgreSQL/MongoDB) with Admin Panel | Respects the constraint of not changing the admin workflow. Building a new admin panel would require training and change management for a process that already works. |
| Google Apps Script as Backend API | Node.js Server parsing Sheets API | Zero infrastructure cost and avoids managing complex OAuth credentials. GAS acts as a simple, stateless JSON endpoint. |
| Next.js for Frontend | Vanilla HTML/JS or React SPA | Next.js provides excellent routing, component encapsulation, and potential for future API route additions if the architecture scales. |
| Client-side Polling over Manual Refresh | Manual Refresh by Admin or WebSockets | WebSockets weren't possible natively with GAS. Polling at reasonable intervals ensures TVs are always synced without any human intervention or heavy server load. |
| No Additional Database | Caching layer (Redis/Supabase) | Keeps the architecture strictly serverless and zero-cost. The scale of requests (a few TVs polling every few minutes) is well within Google's quota limits. |
Implementation Details
Admins only need to update their usual spreadsheet. Google Apps Script serves this data as a JSON REST API. The Next.js frontend, displayed on the TVs, periodically polls this API. If a schedule change occurs, the TV display updates automatically without anyone needing to touch the TV or refresh the browser.
Challenges
Designing a UI that remains legible across various TV sizes and distances was challenging. Another challenge was determining an efficient polling interval so data updates quickly without hitting Apps Script rate limits. Finally, ensuring the Single Page Application (SPA) remains stable without memory leaks when running continuously for hours on a Smart TV browser.
Gallery
Business Impact
Information is now available proactively. Participants find their classrooms much faster, resulting in the front office receiving significantly fewer repetitive questions. The internal spreadsheet gained immense value by doubling as a public information source.
Technical Achievement
Successfully transformed an internal operational spreadsheet into a real-time digital signage system using a serverless architecture with zero additional infrastructure costs.
Lessons Learned
Digital transformation does not always mean building a completely new system from scratch. In many cases, the best engineering solution is to extend the value of the systems the organization is already using comfortably.
What I Would Do Differently Today
If the data source were to change from Google Sheets, I would implement WebSockets or Server-Sent Events (SSE) instead of polling. I would also add remote device monitoring, offline caching for network drops, and a health check dashboard to manage multiple screens.